
Machine Learning is transforming our business in PIXTA: The use case of Learning to rank
In the recent decade, Artificial Intelligence or AI has been one of the most spoken-out words. The human being has witnessed how AI redefines conventional businesses all over the world from economics, education to healthcare, and agriculture. In order to become competitive and outstanding in one domain, several companies applied artificial intelligence to transform their business in terms of saving cost, increasing user experience, etc. In the last three years, Machine Learning has become a standard tool to leverage Pixta ‘s business and enrich Pixta’s products. In this article, we would like to present Pixta L2R, our Learning to Rank system.
Data is our power
One of the biggest commercial products of Pixta. Inc is Photo Stock, which is considered as the leading service in Japan. Plus, we expand our business to several related domains such as Fotowa – a hub for customers to book professional photographers, Snapmart – a mobile platform for casual photo selling. All of them are the best resources for Pixta to exploit the most valuable asset in the digital era: DATA.
By 2020, the Pixta platform earned about 70 million images with ~ 2 million customers, and ~400k contributors. Technically speaking, Pixta attains various kinds of data not only a huge number of images and related aspects but also billions of user behavior. This fuel is the inspiration for our decision to create the Learning 2 Rank system.
Data is also our challenge
Even though we have a full house of golden data, we have to face a big challenge that almost all the corporations in the world meet called data mining. For a long time, we possessed data but we did not possess a data driven attitude till 2017, it was like we own an excalibur but use it only to lawn the grass. That was when we decided to establish a data science team, where we incubate AI ideas and employ them to our business.
Big data requires us to spend a large fortune in storing, running statistics, and enhancing the search system. However, the cost is only the surface of an iceberg. Although data is too raw and too messy, there are patterns to learn. That is the reason why we think AI could be the key to resolve the problem by automatically learning such patterns.
There are several criteria in delivering the results of a search on the Pixta photo stock system. Motivated by one of the most important core values of Pixta “Win-Win-Win”, a system must take into account relevance, diversity, freshness, and balance(means both benefits to customers, contributors, and Pixta) while remaining fast in runtime and light in memory consumption..
Relevance
The relevance is estimated by the similarity between the search outcomes and a query of the user. In the other words, of business sense, relevance means our search system is capable of accurately reflecting the intention of users. In technical, we defined a query that is relevant to the item if the query keywords in the item’s tag set and the user must click on the item. For example: when a user queries with a set of keywords: “ beautiful woman cooking food”. You might blame that my illustrating query contains a critical grammar error but this is actually a pragmatic typical pattern of every query of Pixta’s users. Our users tend to issue a list of keywords in preference to a natural sentence with ideal grammar. These keywords are tokenized into a list of terms for matching with annotated keywords of each item. In this example, it is considered as relevant since search results contain the object ‘beautiful woman’, the action ‘cooking’, and the object ‘food’
Diversity
Diversity is one of the most desired aspects of our ranking system. Our contributors tend to upload a batch of images each uploading session and the number of images in one batch can b e upto hundreds or even thousands. These images are visually similar and are annotated with the same set of tags. It could be a disaster if the outcome of a search contains too many alike photos, which might hurt user experience and prevent us from selling proper items.
Freshness
Freshness means the newest items should be brought to the very first pages. It is because the trending of photos is implicitly defined by the new items. For instance, in 2020, the most updated photos could contain information about COVID 19.
Leverage the resource to create L2R
Metadata is the key
As usual, the very first step of an AI project is data analysis. We start by digging deep into our big data database stored on a cloud service for big data. Working with the platform sometimes requires patience because of the size of the data. However, it is worth spending time on this because there are many points that we can gain implicit insights in the data such as user behavior, number of transactions, number of clicks, and the relationship between a query string and each item.
In our business, we come up with three categories of information to exploit: contributor information, item information, and query information.
There are several categories that we include in features such as quality of photos, sale time, frequency of selling, the relationship between query keywords and annotation of images, and contributors’ style.
Data processing
It is time that we have to get our hands dirty. It is reasonable for us to start working with data along the previous year because we would like to attain every pattern in all seasons, yearly events, and recent trends.
- Preprocessing
There are several features that contain a lot of missing values, which are often defined as ‘Nan’ in Pandas. Dealing with this kind of problem, the best solution is to replace the values with default values for example 0 for numerical features.
There is no firm recipe for how to cook the data or preprocess data since it depends so much on specific data. Sometimes, we transfer them to numerical ordered binned, or categorical values. The key is a sense of data.
- Histogram
One of the very first actions in processing data is plotting histograms of data. The diagrams will present a lot more information than we expected. At this step, we can describe basically the information of data in terms of ranges, min-max values, distribution of data, outlier values, abnormal values, etc.
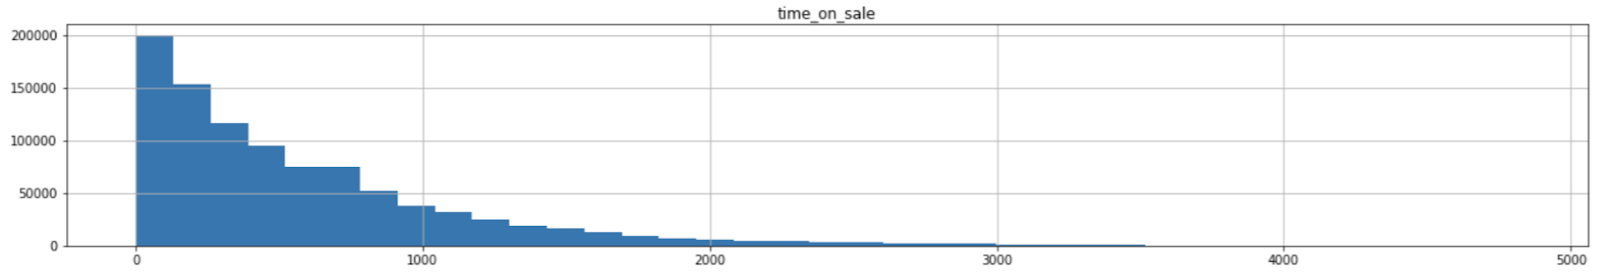
Ex: Time on sale distribution of items.
Again, the distribution of time on sale is similar to what is expected. It follows the fact that the number of photos uploaded to our website always increases. There exist items which have been on sale from the very beginning of our company.
- Correlation
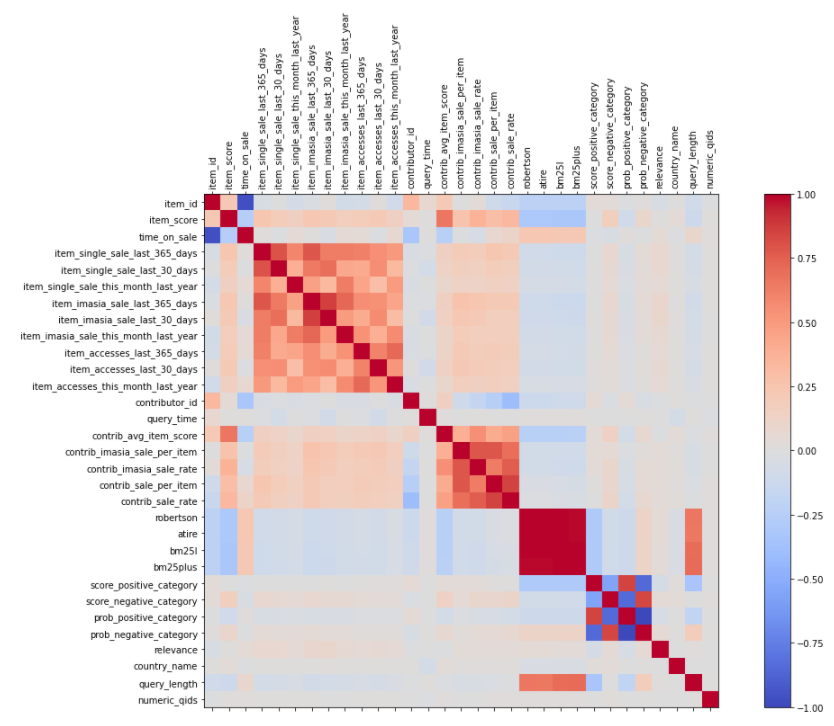
The plotting correlation diagram indicates which features are correlated to each other, so it is probably redundant to use all of them in the same model.
One example of correlation plotting for our data. It exhibits that there is some feature correlated together because their correlation values are about 0.5 or below -0.5.
- Multicollinearity
“Multicollinearity generally occurs when there are high correlations between two or more predictor variables. In other words, one predictor variable can be used to predict the other. This creates redundant information, skewing the results in a regression model. Examples of correlated predictor variables (also called multicollinear predictors) are a person’s height and weight, age and sales price of a car, or years of education and annual income.”
___MulticollinearityDefinition https://www.statisticshowto.com
The information extracted from Multicollinearity helps us reduce the number of redundant features.
There are several different types of methods to detect redundancy in features, we list here two significant ones. However, we have tried others such as p-values, coefficients in logistic regression, or feature importance in tree-based models.
- Relevance system
Inspired by several learning to rank systems of Amazon.com or booking.com, we build a binary relevance system that assigns 3 for clicked items and 0 for non-clicked items according to a specific query.
If you have rich data, which contains information about buying, user’s consideration time, etc, we strongly recommend you to build a dense relevance system. For example: buy = 4, add_to_cart = 3, clicked = 2, etc.
Exploiting short-term behavior
Query Chain
An obvious definition of Query Chain is a sequence of reformulated queries. For example:
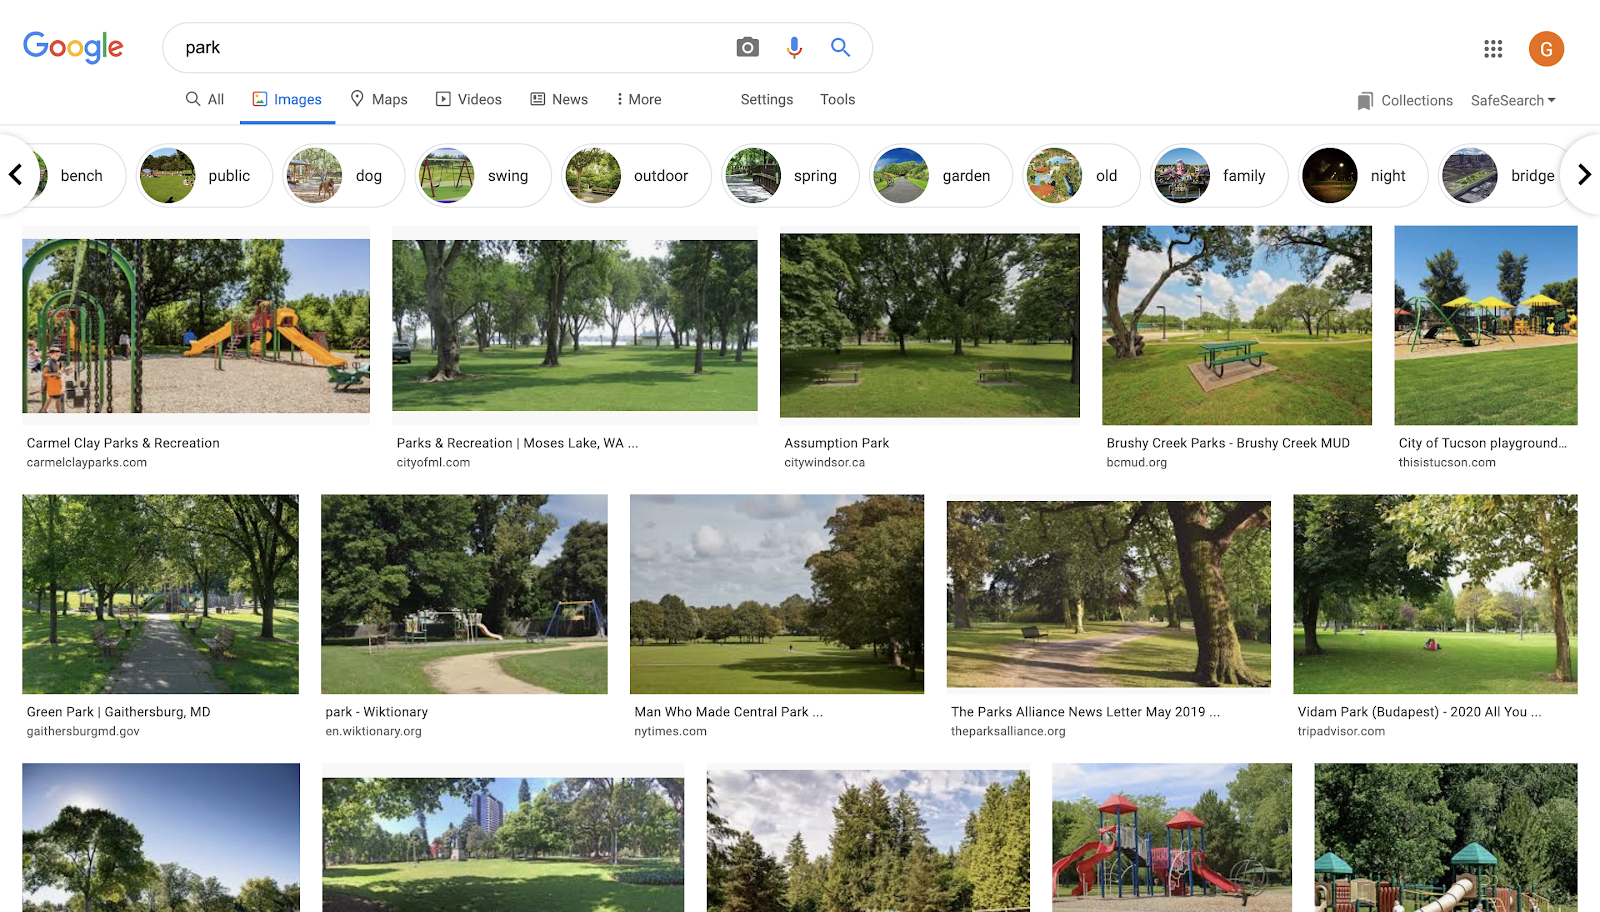
Query 1: Keyword = park

Query 2: Keyword = picnic park
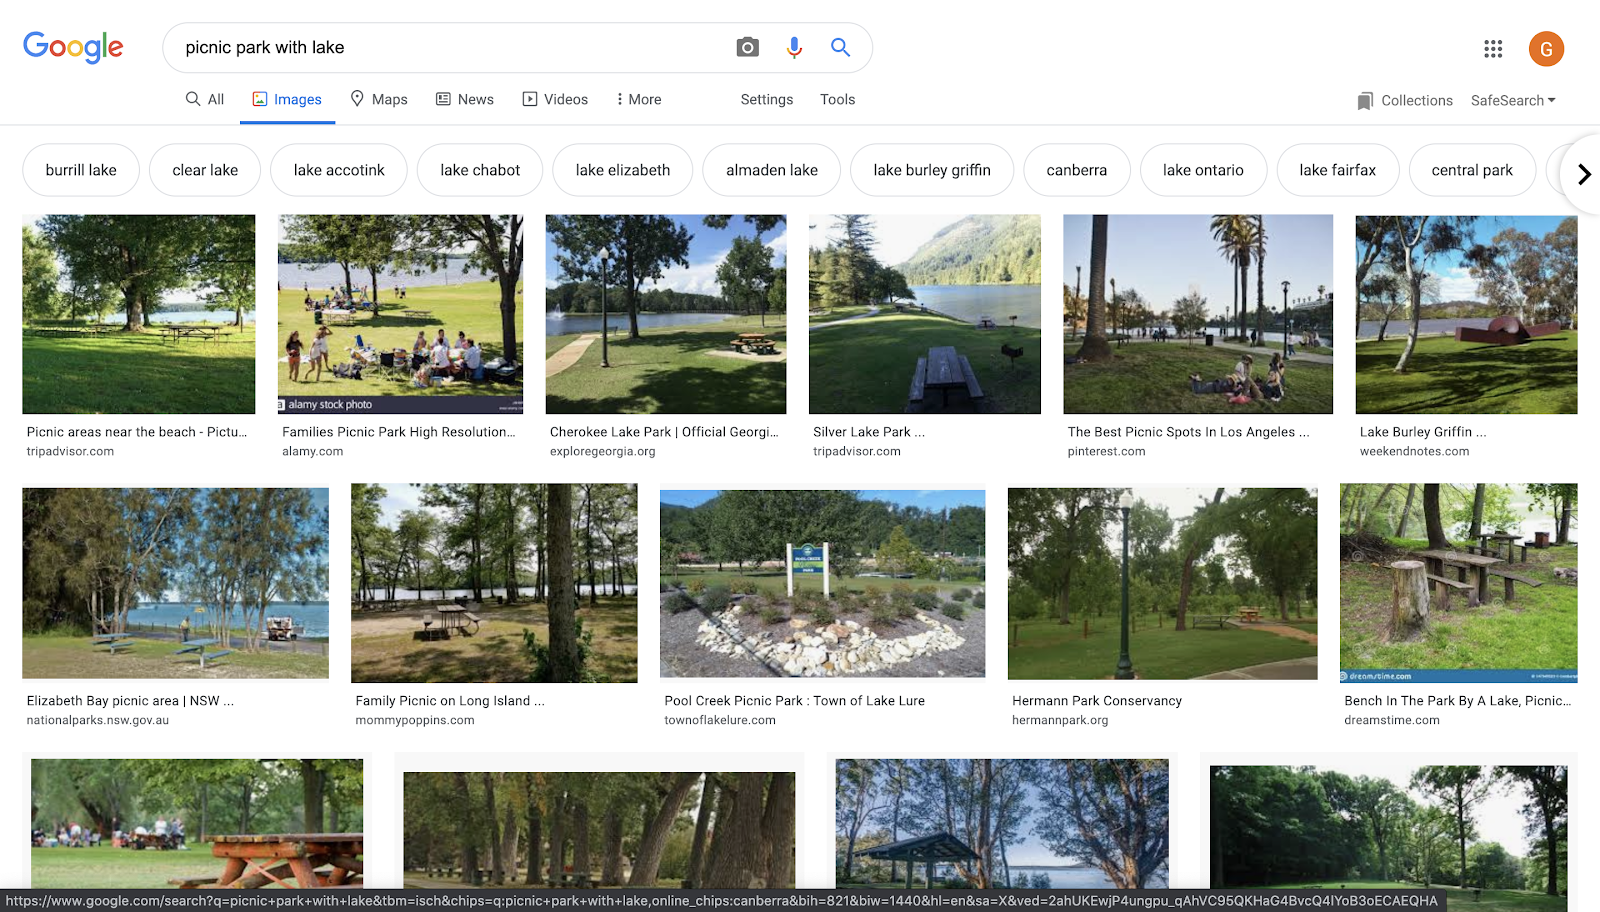
Query 3: Keyword = picnic park with a lake
Query chains help to generate preference judgments with feedback strategies.
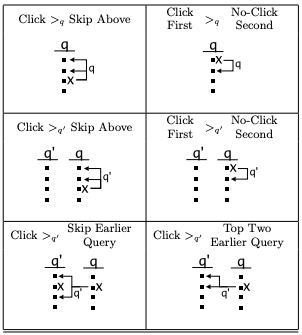
Illustration of Query Chain in [Query Chains: Learning to Rank from Implicit Feedback]
We apply query chains to refine our relevance system in order to refine the output.
Diversity algorithm
There are lots of available diversification algorithms. However, they don’t really work well on our data and they are rather slow. We came up with our own solution. Simply speaking, our algorithm rescores the relevance of an item base on cumulative similarity of the items that come before it. The algorithm is defined as follows.

Where  is the decay term, is chosen so that the series
  convergent, which means
 ![]() , and
, and ![]() is the diversification window size. Lastly,
is the diversification window size. Lastly, ![]() is the coefficient controlling the effect of diversification. Currently, we set
is the coefficient controlling the effect of diversification. Currently, we set ![]()
Unlike available algorithms that usually run in quadratic time, the complexity of our algorithm is linear, given by
![]()
Light GBM
LightGBM is a gradient boosting framework that uses a tree based learning algorithm.
Instead of expanding level-wise, LightGBM grows tree leaf-wise which allows the model to reduce more loss than level-wise algorithm.
One of the most interesting characteristics of LightGBM is that it’s very light as defined in its name “Light” GBM. Plus, it requires a small amount of memory to run on production settings. It’s highly recommended that Light GBM should run on a big dataset because this model is sensitive to overfitting.
The most efficient way to implement LightGBM into one system is to use LightGBM package implemented in Python:
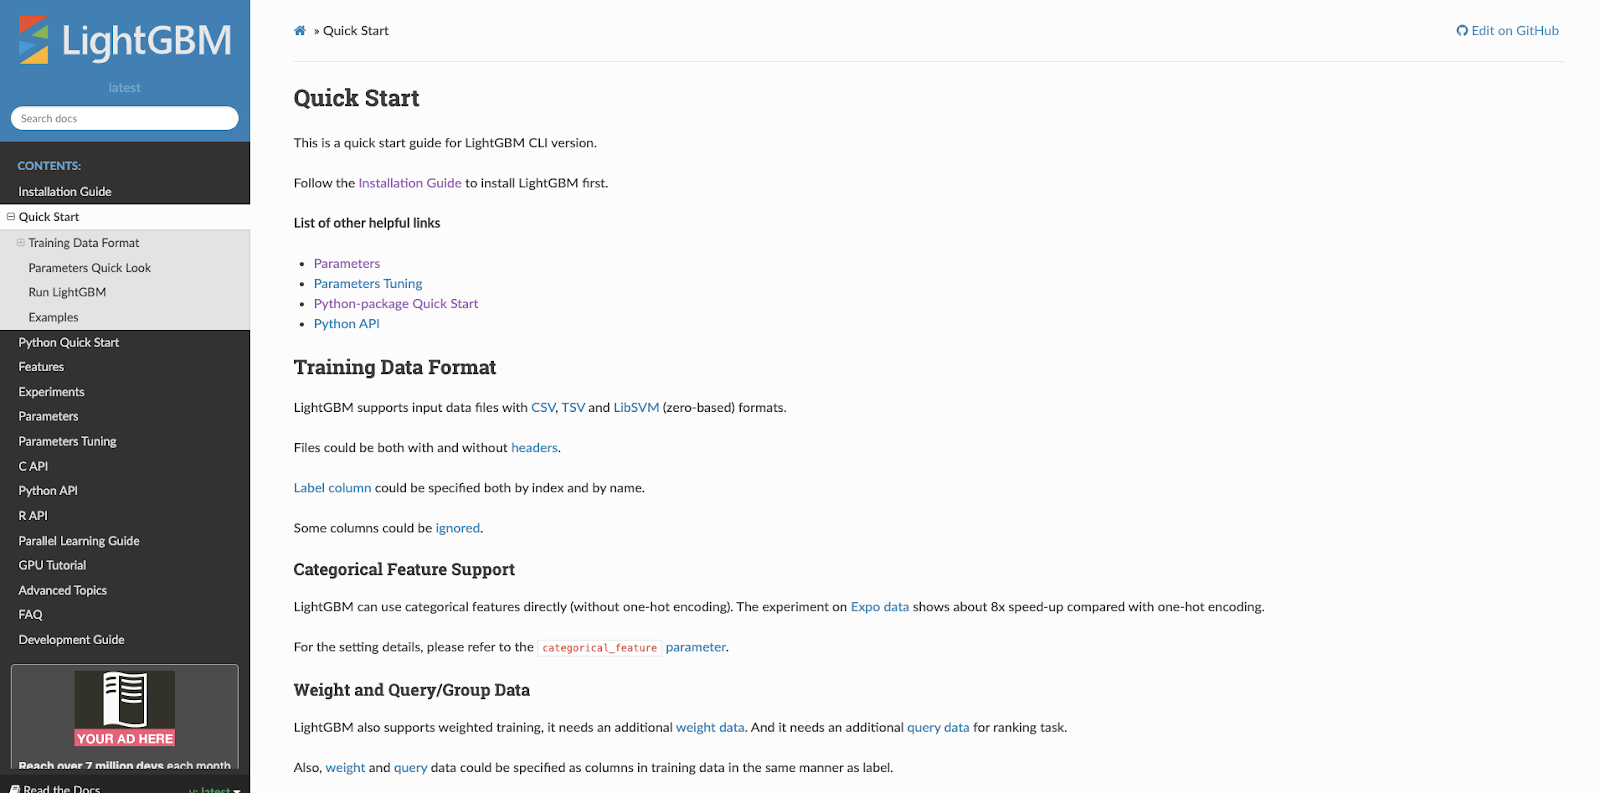
The package contains everything you need to bring LightGBM into our system. However, in order to employ it accurately, we should have an insight of parameters configuration which are described in the blog.
Lesson learned
User behavior
Irrefutably, user behavior is the soul of the project. I strongly hold that data scientists and engineers should take a closer, more careful look at the data before exploiting it.
Simple first
If you are working with huge products, the speed of the program is of extreme importance. That’s the reason why we should try the simple method first.
Business dependency
We have suffered some difficulties when discussing with our leading board. There are several reasons why relevance is not the most important point but we should balance every standard aspect. In our case we must satisfy relevance, diversity, freshness, speed, etc.
Continue thinking
We came up with several ideas while working on the project. If we want to keep track, just build a project log and put there every idea that you might find it helpful.
That’s not all folks!
Future work
We can do better with metadata by analyzing user behavior meticulously. However, this might hurt our runtime and also lead to constraints in the system.
As you see in our feature list, we did not exploit visual features. This is due to the fact that visual features greatly diminish our runtime complexity. However, we are working hard to find a reasonable solution to employ visual features.
Last but not least, when the system applied Learning 2 Rank, the users’ behavior might change. In this case, it is necessary to have a model that adapts itself to new data. This is where Online Learning is taken into the account, which allows the system to attain data, train with the obtained data, and verifies the metrics automatically.
Writer: Lab Team
Like & follow fanpage of Pixta Việt Nam to keep update with useful technology information!
